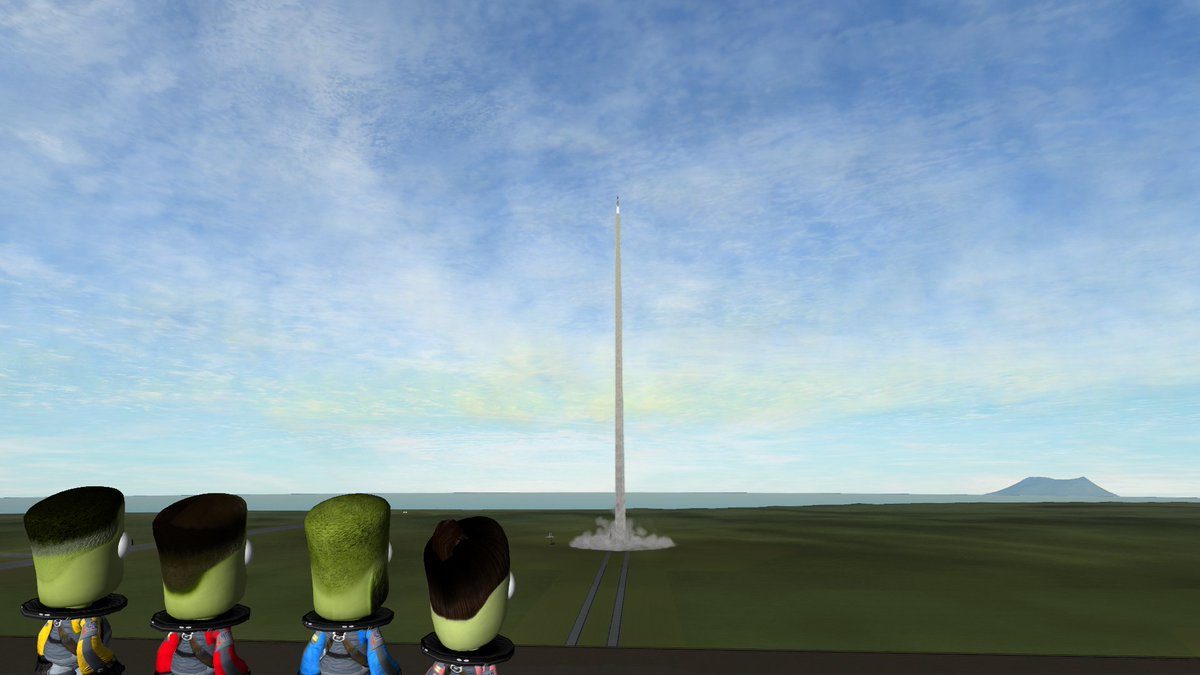
 The end of last week saw what we like to call the “final flight” of the Progeny Mk5. Although the Mk5 will continue to serve our sub-orbital needs the rocket has been redesigned into two new Block I and Block II variants that will be the only type of Mk5 flown going forward. This Mk5 was built from spare parts originally meant to replace any broken/damaged parts for the Mk5’s initial 5-launch campaign, which didn’t need them, and the boosters are less powerful than the newer Block variants. We’re happy to say the launch was a complete success and a great end to the initial run of Mk5 rockets, which only suffered one failure.
We made some changes to the flight profile of this launch, which was the first Mk5 to leave the pad at an 85° pitch angle rather than 87°. Instead of waiting for the nose to drop 1.5° of pitch before igniting the next booster, we only waited for 1° and when the 3rd stage liquid booster engine fired the Automated Flight Control System took control of the throttle to maintain a TWR of 2 until it detected dynamic pressure begin to fall, at which point it throttled up to full while ensuring pressure continued to drop. These changes were made to see how a faster vertical ascent would affect the flight when launched from a lower initial pitch.
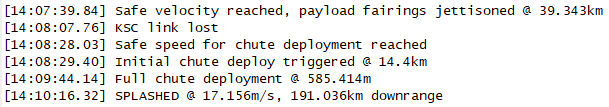
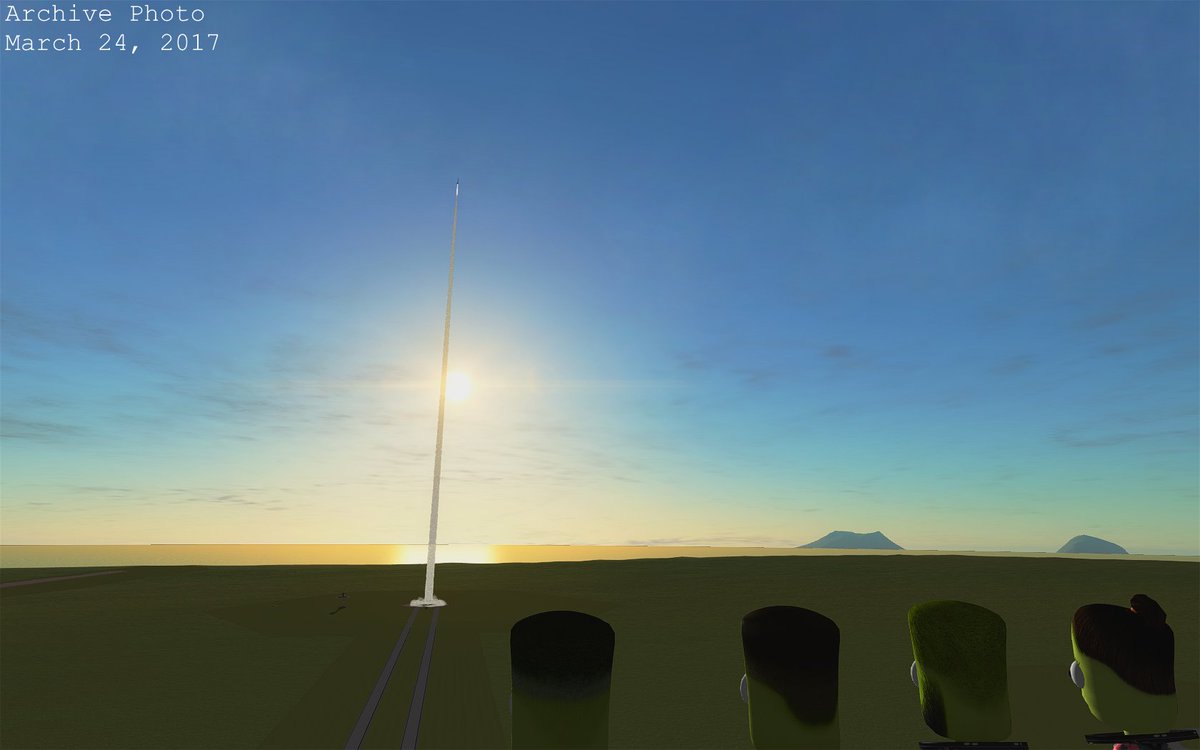
Upon launch the nose raised about 1.1°, which is similar to the performance of the Progeny Mk4. The shorter coast periods had no ill-effect on the rocket due to the higher pressures encountered when given less time to slow down. The auto-throttle of the third stage booster worked great and the rocket coasted to an apokee of 107km while gathering data from both its scientific instruments. It fell back through the atmosphere with a 25s comm blackout due to re-entry heat and splashed down in the Kerblantic 67km downrange after a total flight time of 8m37s. You can view complete telemetry for the mission here.
Detailed Telemetry Analysis
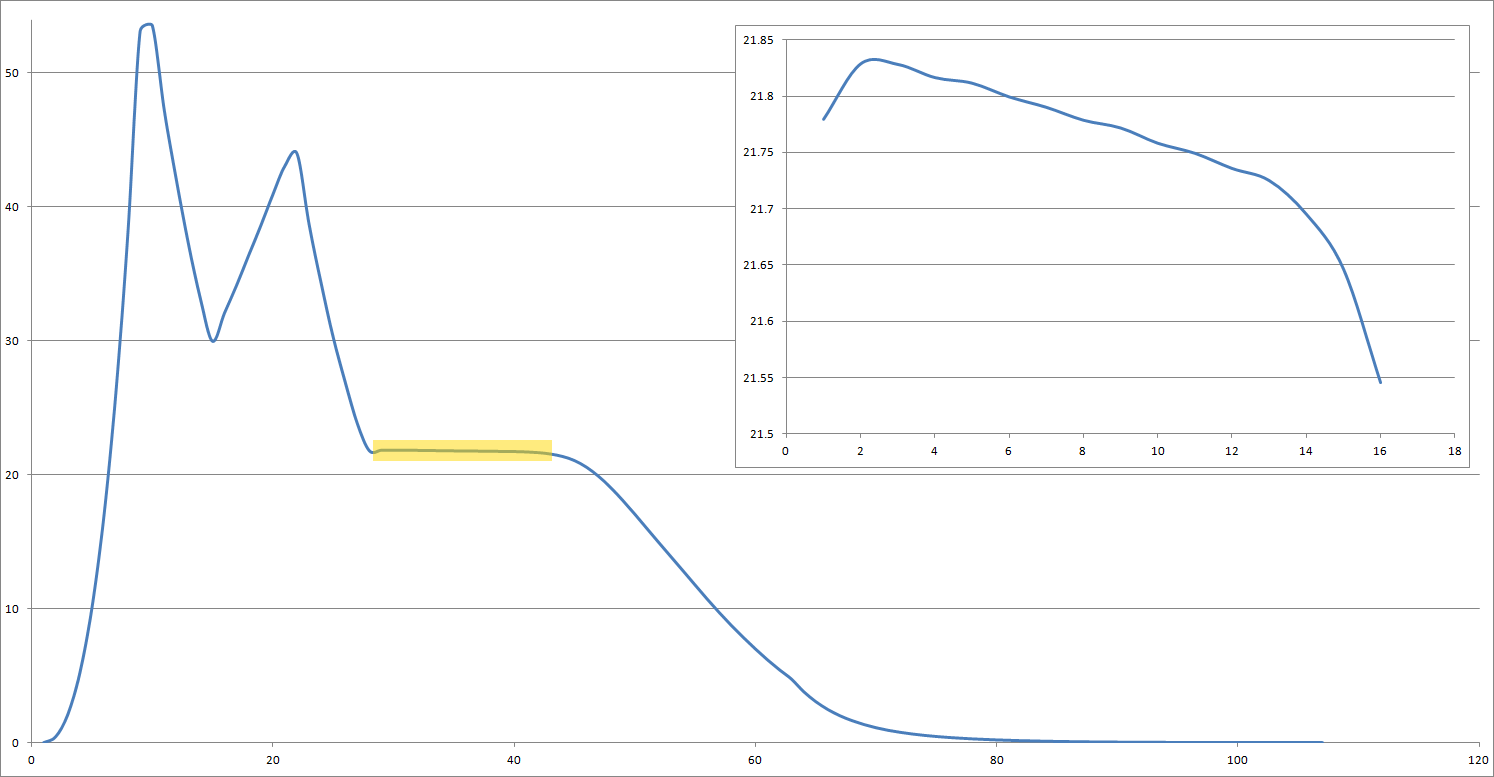
Dynamic pressure in kPa over time in seconds. Inset graph shows pressure over seconds from the start of the third stage burn. Click for full-size
Let’s start with a look at the performance of the auto-throttler. Although the third stage booster can sometimes ignite at just the right time and with just the right throttle to not increase dynamic pressure during its boost, more often than not the predetermined throttle setting at ignition increases dynamic pressure – to a point. Eventually the rocket will get high enough into thinner air that pressure starts to fall, at which point it would be good to throttle up except that doing so can begin to increase pressure once again. The simple auto-throttle code doesn’t let the throttle climb and actually pulls back a bit if it detects the pressure start to rise, as you can see by the squiggly inset graph as slight dips of pressure show the throttle being increased/decreased.
This simple method worked really well but it did have one small drawback – at some point pressure begins to fall faster than the throttle is being increased, noted by the large dip at the end of the inset graph. Ideally this means we should be throttling up faster, but the code only applied changes to the throttle at a constant rate. If we are truly pushing for every meter out of our apokee, then getting up to full throttle 1-2 seconds faster could make a difference. To test this however we will leave the code as-is for the first Block I launch then attempt to make it smarter at throttling up dynamically for the second Block I flight.
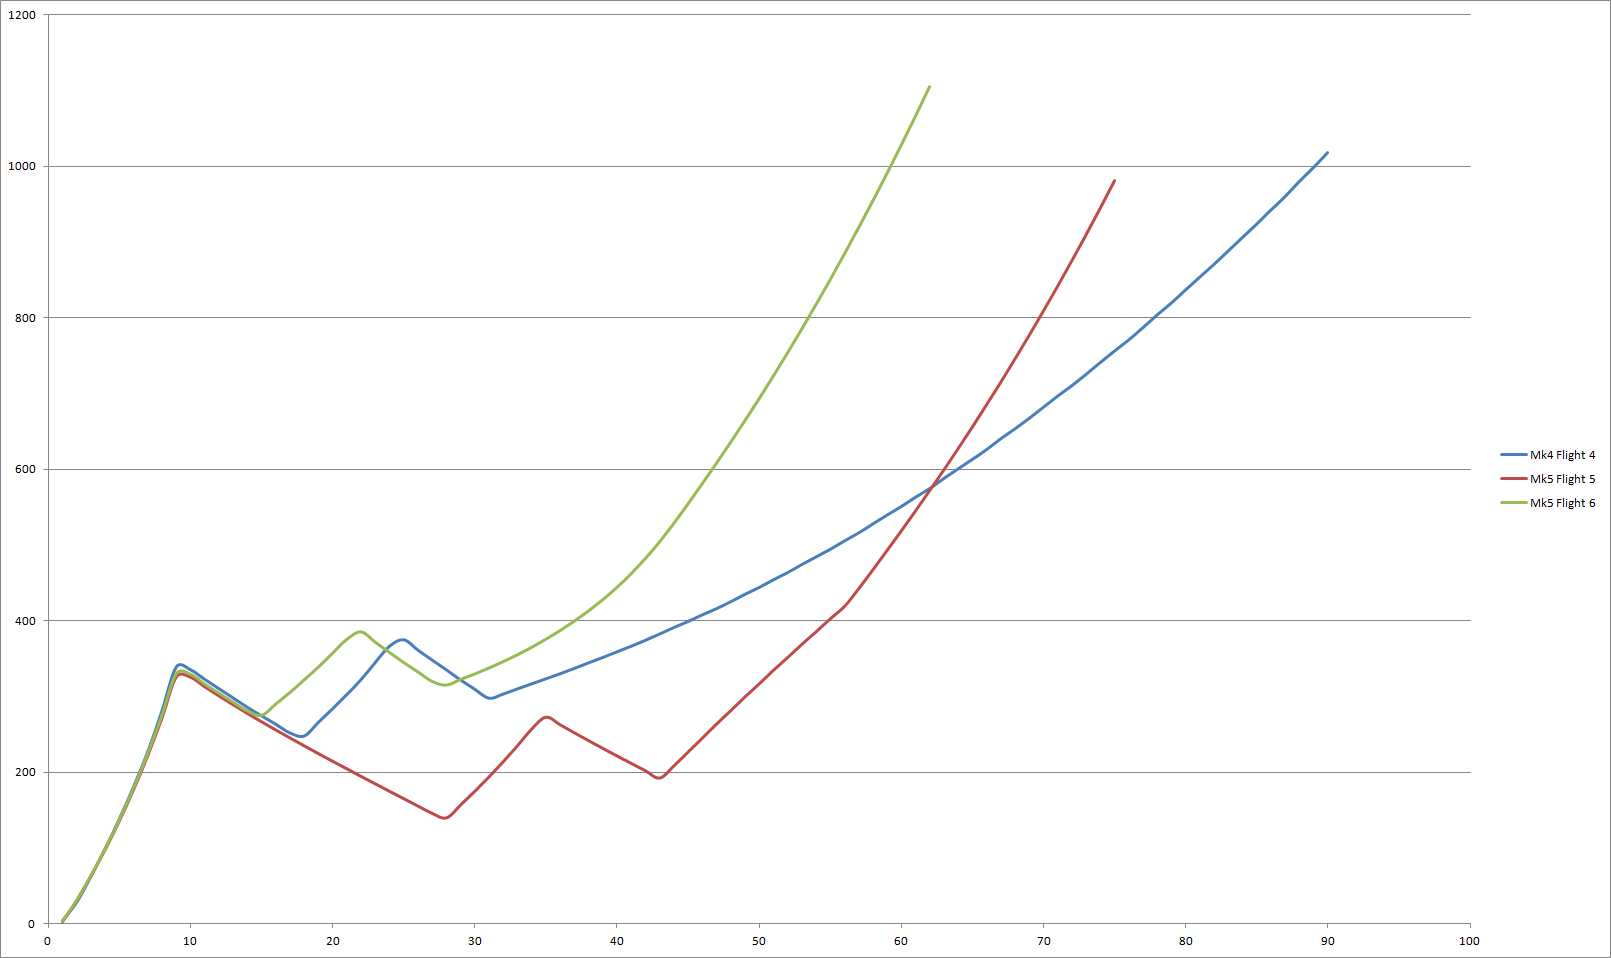
Surface velocity in m/s over time in seconds until the end of third stage propulsion. Click for full size
The first thing to note about this graph is that, as we pointed out in our Mk5 design analysis, looking at the first stage boost you can’t see any real difference despite the Mk5 Flight 5 lifting off near-vertical, showing that launch pitch is largely irrelevant early on in the flight. Later during the coast stages you can see where pitch makes a big difference. Standing almost straight up the Mk5 Flight 5 had to wait a long time for the rocket to tip over 1.5° during coast phases, whereas launching at 85° the Mk4 Flight 4 only took about half as long to drop its nose 1.5° to ignite the next booster. As expected, the Mk5 Flight 6 took the shortest time between coasts after launching at 85° and only waiting for 1° of pitch change. Unlike the Mk5 Flight 5, both the Mk5 Flight 6 and Mk4 Flight 4 were able to recoup the losses in speed from their first coast period, although the Mk5 Flight 6 didn’t get going all that much faster than the Mk4 Flight 4 despite its earlier ignition, a sign that atmospheric drag did some pushing back in addition to a slight decrease in thrust due to the higher atmospheric pressure of the lower altitude at which the Mk5 Flight 6 ignited its boosters. Although all three rockets launched at nearly the same TWR (4) they did vary in weight with the Mk5 Flight 5 the heaviest at 1.841t, then the Mk5 Flight 6 at 1.826t and the Mk4 Flight 4 massed 1.780t – hence the slight variation seen at the top of the first stage boost.
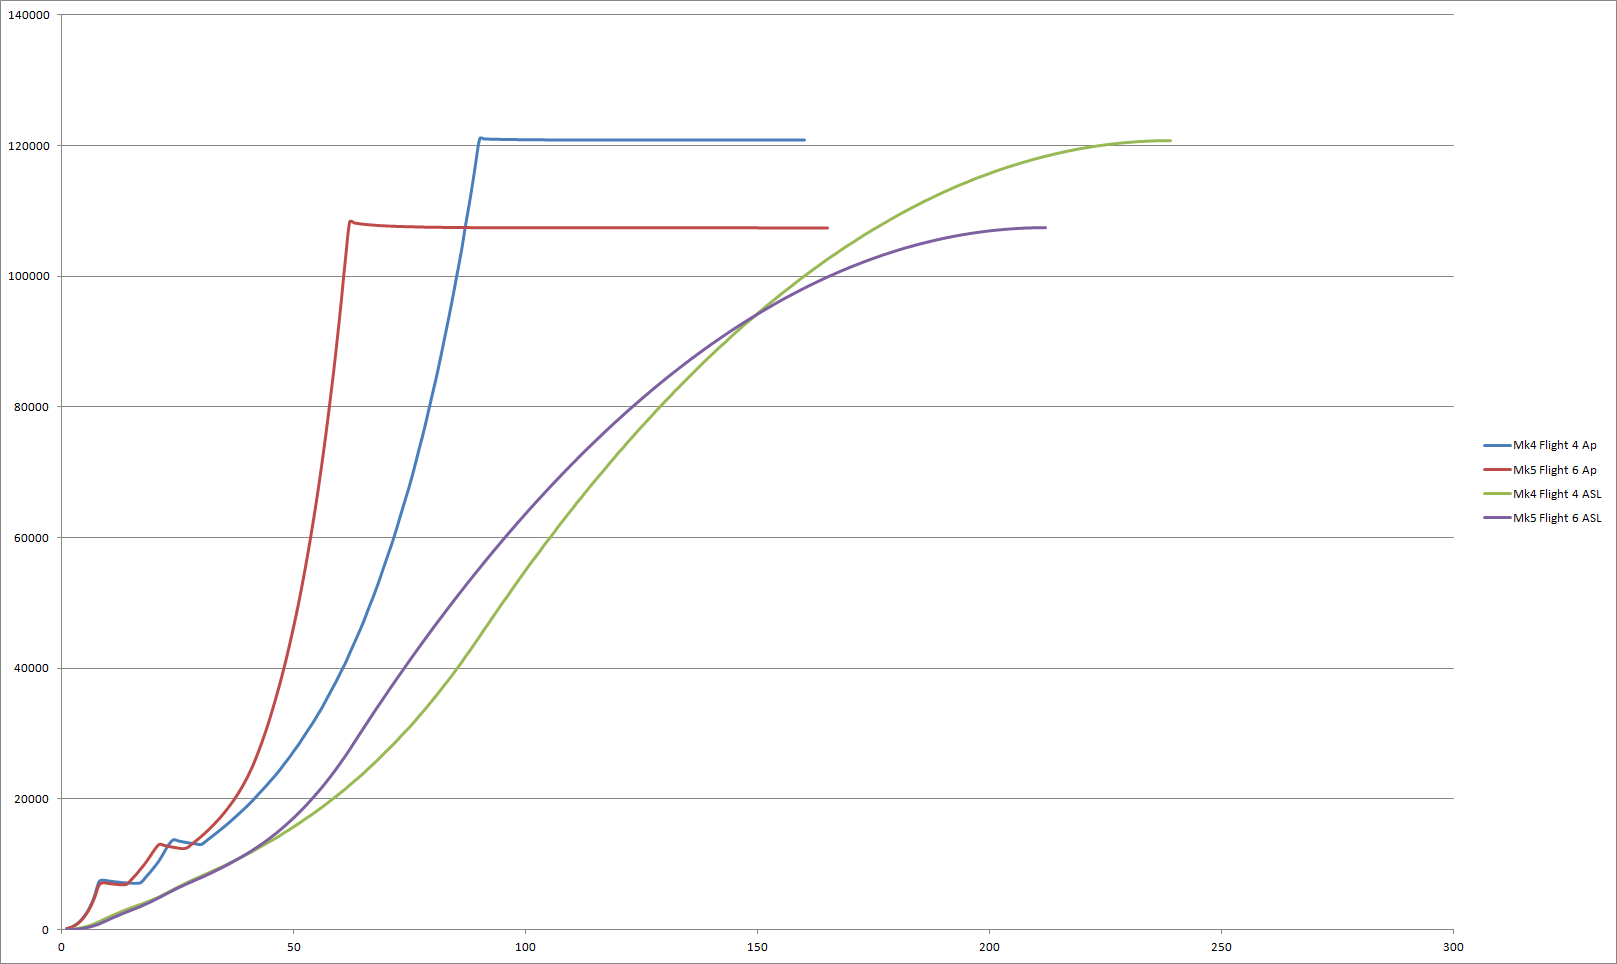
Altitude ASL in meters over time in seconds until apokee reached. Click for full size
So we saw in the last graph the Mk5 Flight 6 actually got to a higher top speed during ascent than the Mk4 Flight 4 despite starting lower in the atmosphere and yet we see here the Mk4 handily beat the Mk5 in apokee. This graph also shows how speed doesn’t matter as much as vertical pitch. The fact that the Mk5’s apokee is increasing faster than that of the Mk4 is making no difference to the actual altitude the rockets are traveling at over the same period of time. Note the deviation in altitude does not become apparent until almost a minute into the flight when both rockets have already nearly expended their fuel. Despite the fact that the Mk5 is ascending more vertically and traveling at a higher velocity, the Mk4 still manages to beat it. The effect of gravity losses are readily apparent here, with the Mk4 using less energy to fight against the pull of Kerbin and instead putting it into a longer but higher flight. Of course, there is a point in which flying closer to horizontal will begin to produce negative gains as the rocket’s trajectory flattens out too much.
Mk5 Block I Flight Profile
Given all the data we’ve collected from the Mk5 and compared to the Mk4 we feel that we are looking at an optimal ascent for the Mk5 Block I using an initial 85° launch pitch with a coast period defined by 2° of pitch change, with the longer coast period accounting for the increased power of the rocket. We aren’t positive about this however so the first Block I will still coast until 1.5° of pitch change and the (yet to be announced) third & fourth Block I launches will increase this to 2° so we have some hard data to look at. The second launch will also coast to 1.5° because we will be changing the behavior of the auto-throttler as mentioned above and don’t want to otherwise affect the ascent profile so we get consistent data for comparison. Likewise the third Block I launch will revert to the original auto-throttle code and the following fourth launch will use the more dynamic throttle. Assuming all four launches go well we should have an optimal Block I ascent profile locked in by the end of the year.